They say time flies when you are having a good time, but for those of us in the HVACR distribution business, the past year hasn’t been all that much fun. And if time has flown by at all, it probably has more to do with the momentous task of keeping our businesses rolling along—without much assistance from influences such as recovery plans or economic rebound.
Back in 2008, I did a review of the HARDI Profit Report—times were good back then. In that report, we outlined the benefits of using the Profit Report as a "no brag factor" benchmarking tool. Today, we're going to touch benchmarking and move further down the road with some quick analysis of our industry in general.
- Before we begin, let me make a couple of quick housekeeping points:
- The 2010 HARDI Profit Report uses data from "The Recession" 2009.
- The 2008 HARDI Profit Report uses data from "The good days" 2007.
- The page numbers we refer to are in the actual Profit Report.
The 2010 Profit Report reinforces what most of us suspected: The bottom line of most distributors took a hit in 2009. We won't use this article as an excuse to recite profit numbers; instead, we want to drive home a few trends that will help you make better use of the report today and help you improve your business throughout the next business cycle.
Benchmarking –Activity based costing
There is an old saying, "facts, not opinion, drive good decisions." Yet, most distributor teams still lack reliable data on which to base their customer selection. Understanding cost data is the first step in recognizing which customers contribute to the bottom line. More importantly, this data provides a bit of insight into the overall efficiency of the logistics engine driving the distributor’s business. If you lack the resources to produce Activity Based Costing data for yourself, the Profit Report provides you with a good industry approximation. If you do have ABC data, compare your numbers against the Upper Quartile firms.
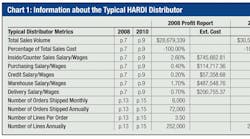
For illustration, I have dissected the numbers for a "typical" HARDI distributor. If you signed up for the Profit Report (and I encourage you to do so), I recommend using your own numbers following this model. If you do not take part in the PAR process, you can still benefit by looking at the "typical" numbers.
In the box provided in Chart 1, I have provided several details regarding the typical distributor. I compared numbers from the 2008 and 2010 reports. I selected these numbers because I thought it might be fun to contrast "the good days" against last year'’s nasty little recession. In each case, I have provided the reference page from which the information was gathered. The intent here is to allow you to follow along and plug in your own numbers.
What is the cost of processing an order?
Remember what I said earlier, this is a very good approximation. It's not "dead on," but if you lack a real process, it gives you a guideline. In this calculation, we are going to make a couple of assumptions:
- Inside sales and counter people are the ones most likely to enter orders.
- The credit department's time is equally spread over each order.
Based on this information, it now costs the typical HARDI distributor $13.15 per order just to get it into their computer system. What’s worse is that the price for this little task has ratcheted upwards 18 percent in just a couple of years. Interestingly, during the good years, high performing distributors actually paid just a bit more for entering an order. But when tough times hit, they were able to control expenses more closely and drive the cost downward by 36 percent.
Page 2 of 3
If we add purchasing to the mix, we must assume that it is possible to evenly distribute your purchasing people’s time over every order. Again, this assumption is not 100 percent correct, but it does allow us to once again develop a better understanding of our business.
Ever wonder where the gross margin goes? Ever wonder about the value of those small-potatoes orders at the counter? Based on our numbers here, any order that produces less than $15.28 just drips the pen into red ink—and that doesn’t even take into consideration warehouse and several other costly points.
So just what does it cost us to receive an order and ship it out of our warehouse? Chart 4 shows the costs associated with a typical distributor. Quite frankly, I am a bit concerned. Here's why: our average order size is only $328. We all know that our industry handles orders that range into the thousands of dollars, maybe into the $10,000 range and above. For every thousand-dollar order, we must be handling quite a few orders where we really make zero dollars.
But, there is a ray of hope. Out there, a group of distributors has learned how to increase efficiency in handling orders. Whether it be from better selection of customers (more on that later) or by devising processes that build efficiency into their business, the upper quartile distributors learned to migrate their costs down during the economic storm. Instead of looking for ways to cut, they have devised systems to change the very nature of their business.
It pays to be a high performing distributor
While profits for everyone tracked downward in 2009, those distributors who operate in the upper 25 percent saw a far smaller decrease in overall profits, contrasted to their counterparts. Upper quartile distributor profits are down 17.5 percent since 2006, while the typical distributor has seen profits slide by 64 percent over that same period. As a matter of fact, even during this recessionary period, upper quartile distributors produced a greater profit margin than their average counterparts during the boom times of 2006. (Page 33 shows the historical profit trends for everyone, and page 9 contrasts typical vs. top performing.)
If you find yourself outperforming the typical distributor, don't get hung up in high-fiving yourself. Instead, remember this: Distributors in the bottom quartile find themselves treading water in a sea of red ink (page 37). They didn't do all that well in the "good days," and they may be looking for the escape hatch today. There may be time for some of these organizations to rebuild. But if we see a double-dip in the economy, there may be some fixer-upper businesses on the market.
What can I do to make my company a top performer? Analysis of the Profit Report indicates no central point delineates upper quartile from the rest. Instead, there seems to be a combination of differences. Review of year over year differences (including information from the 2008, 2009 and 2010 Profit Reports) indicates a significant difference in the way gross margins, expenses, inventory turns and A/R are handled. Surprisingly, the sales-per-employee number for high performers varies compared to the typical distributor. Some years, upper quartile distributors actually sell less per employee than their colleagues.
What we do notice is that upper quartile distributors continually have better scores than their brothers in the trade in four key areas:
- Higher gross margins.
- Lower operating costs.
- Better accounts receivables.
- More turns in their warehouse.
The question is why?
Page 3 of 3
Why? Process
I believe the answer lies in process. During our research on target-driven sales, we consistently discovered that nearly everyone believes they have a process. Yet when faced with questions that drilled deeper, we heard answers indicative of no process. To be a process, there must be a framework. Processes by their very nature are:
- Defined and spelled out – What happens in your business may be a thing of beauty, but if there is no document that defines procedures, steps and responsibility, it’s not a process.
- Measured – What you measure improves. Without a scorecard for improvement, it is impossible to gauge success, failure, improvement or slippage.
- Tweaked and improved – A procedure remains constant; revisit the process and measure. Modify the process to match business conditions.
- Reinforced and coached – Experience with high performing companies indicates that even senior-level people are required to follow the process. Think about the lack of traction of CRM systems in distribution today. Often, company managers are reluctant to “force” their most experienced sellers to provide and maintain such basic information as customer e-mail addresses and phone numbers.
All the areas with continually higher scores are process-driven. We don't have the time here to outline the best practice process for all of them. So let's pick just one – Higher Gross Margins.
Let's touch on Gross Margin
In 1991, I attended my first "distributor branch manager" training class. One of our first sessions covered the basics of "matrix pricing."” Matrix pricing equates to a simplified segmenting of customers by size, industry type and other variables.
Young and impressionable, I returned to my business anxious to put this system to the test. What I discovered was this: matrix pricing was complicated, it's hard to implement, and back in 1991, it was mostly done by trial and error. Happily, things have changed. Computerization allows management to manage areas that were once too time consuming.
Today, you can extract the data for making scientific pricing decisions, automatically pulled from most business systems. Armed with detailed analysis, it is easier to sort products and customers based on price sensitivity. Subtle tweaks to gross margin levels provide fundamental gains in margin. But there is a risk. Most sales teams fear pricing themselves out of the market. A data-driven process allows companies to test pricing theories and measure results based on real data—not fears and off-hand customer comments.
Best of all, distributors can tap into the resources of organizations that specialize in data-driven pricing processes. One such organization is David Bauders of Strategic Pricing Associates. Several of Bauder's clients have gone on record with comments like, "greater than a 2 point increase in gross margin." The beauty of margin increase is it requires no new warehouse, delivery vehicles or people; it falls directly to the bottom line. Now go back to your Profit Report and see the impact of 2 points.
Scooting on down the road
It's not all about gross margin, but gross margin improvement is a good start in understanding the idiosyncrasies of refining your processes. Remember, distribution is a game of singles, not home runs. Singles come from incremental improvement. And, it’s hard to improve something when you lack the feedback mechanism of good data.
I encourage you to pull out your Profit Report and begin looking for areas where you can improve. If you didn't take part in this year's HARDI report, get a copy and call us. We'll be happy to spend some time talking about how you can get started; it never costs anything to chat.
Frank Hurtte speaks, writes and consults on knowledge-based channel issues. His work centers on using processes to improve the bottom line. Hurtte has agreed to provide our readers with a short exploratory meeting. Contact Frank at [email protected], 563-514-1104 or visit riverheightsconsulting.com.


